
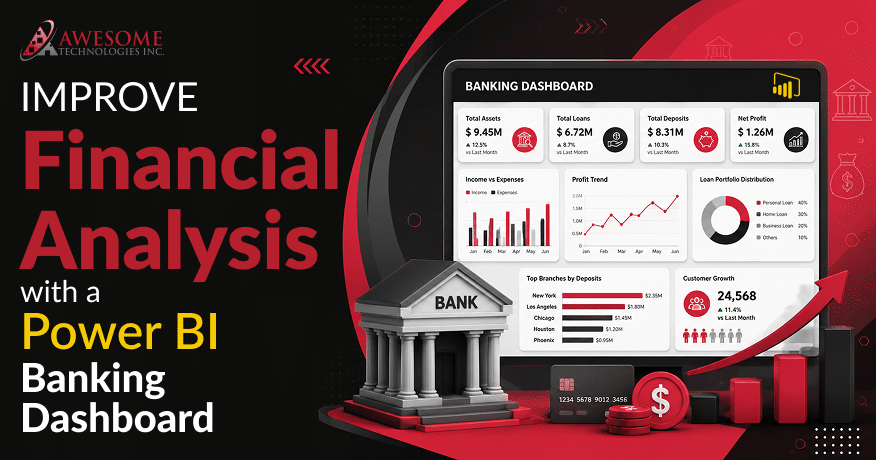
Banks and credit unions generate very large volumes of data on a daily basis, which include loans, deposits, branch operations, and risk signals, among other data. The majority of this data reside in core banking systems, loan management systems, and spreadsheets which are not reliable. Power BI accounts for roughly 30 percent of the total business analytics market share, serving over 375,000 businesses. The following is a detailed guide to Power BI for Banking Dashboard on what the dashboard consists of, measures to be included in it, and how to set it up, as well as lessons to be learned from it.
What is a Power BI Banking Dashboard?
Definition and Purpose
Power BI offers a financial analytics dashboard for banks that offer real-time analytics and visualization for the banking industry. Unlike PDFs that get outdated once they are created, the real-time banking dashboard in Power BI is connected to live or periodic data based on how reporting is done in such a way that reduces dependency on static reports.
Why Banks Use Power BI for Financial Analysis and Banking Data Analysis Using Power BI?
Financial analysis with Power BI begins by connecting banking data through databases, APIs, warehouses, middleware, and connectors. Visuals can be created and customized by analysts and business users through self-service, and governed datasets offer consistency with the help of a BI dashboard for banks.
How Power BI Banking Reports Differ from Traditional Banking Reports?
A traditional banking report is typically one where a user extracts data to Excel, creates a manual pivot table, and sends out the document as an e-mail attachment, which becomes outdated as soon as it arrives at its destination. However, with financial analysis dashboards, the data refresh occurs either in real-time or according to scheduling.
How a Power BI Banking Dashboard Improves Financial Analysis?
-
Bank Financial Dashboard
Instead of having loan information from one source, deposit information from another and branch information from another source, the bank financial dashboard helps to bring all of this information into a centralized model. This means that financial analysts can spend less time reconciling numbers that must always add up.
-
Power BI Banking Metrics
Net interest margin, loan acceptance ratio, and other banking indicators are readily available to refresh in a timely schedule, or even in real-time with the help of DirectQuery or Streaming. The decision would depend on your database design.
-
Focuses Revenue Analysis and Cost Trends
Because banking data visualization in Power BI makes trend analysis much easier, it will be much more convenient for you to notice such trends as an increase in the cost per loan or a decrease in deposit growth rates long before they become apparent in your monthly reports.
-
Supports Data-driven Decision-Making
It will be helpful for your decision-makers to see real figures instead of estimates for the previous month. That means that you can make your personnel, pricing, and risk decisions before the end of the quarter using a banking business intelligence dashboard.
Key Metrics to Include in a Power BI Dashboard for Banking KPIs
Here is how things can go when you are still unsure of the metrics to incorporate in your dashboard. There is a list of metrics that have typically been incorporated into banking dashboards done the right way:
| Metrics | Why Does It Matter? |
| Loan Portfolio Analysis Performance | Represents the total level of lending and their growth/performance for different kinds of lending |
| Deposit Growth | Provides a representation of the speed at which the institution is growing its funding sources |
| Net Interest Margin (NIM) | Reflects the interest rate spread, which is a fundamental profitability metric |
| Non-Performing Loans (NPL) | Detects risks associated with the portfolio through overdue loans |
| Customer Acquisition and Retention | Provides the count of new customers and existing ones |
| Branch Performance | Compares the efficiency and profitability of the different physical locations |
| Profitability Analysis Product wise | Identifies the kind of loan/deposit products that generate margins |
| Liquidity and Cash Flow Metrics | Reflects the liquidity of the organization’s assets |
It is necessary to look into the issue of net interest margin since this is the only figure looked at by bank leaders first, and any change, even a slight one, such as a change from 3.2% to 3.0%, can mean many millions in losses in terms of margin. This is why net interest margin is better tracked in real time rather than in quarterly reports.
Essential Features of an Effective Banking Dashboard
- Interactive filtering options of charts and filters make it possible for users to filter data based on branches, products, and period, without generating multiple reports.
- Near Real-Time Data Refresh guarantees that the data is always fresh as, in case of banking, it is extremely important, since the risk warning can become very dangerous if it appears late.
- Role-Based Views provide different views to users based on their roles using Power BI workspaces and RLS.
- KPI Scorecards are customized individually for each team and highlight the small number of KPIs of this particular team and do not hide them in the dashboard of another person.
- Mobile Accessibility provides an opportunity for branch managers and executives to be informed through mobile devices while visiting the office or participating in board meetings.
Benefits of Using Power BI in Banking
- Power BI financial reporting for banks automates much better than before as the financial reporting dashboards provide information automatically based on scheduled or live data feeds.
- Greater Regulatory Compliance means that the Power BI financial dashboard provides regulatory reporting through consistently audited and governed reporting built from governed data sources.
- Improved Risk Management means that the NPL trend, concentration risks, and delinquency pattern will be seen faster through scheduled or near real-time dashboard updates. This refers to using a risk management dashboard too.
- Advanced Customer analytics become possible through integrated data that combines customer transactions, products used, and engagement levels to identify those customers who should receive additional investment in their relationships.
- Operational Efficiencies mean that the data on branch and staff performance is consolidated in one system, making it easier to understand what needs to be done to improve.
Power BI financial reporting helps automate the reporting process with the help of scheduled or real-time data feeds, which helps financial institutions decrease their manual work and increase efficiency when making decisions. With these possibilities, the Power BI benefits companies to improve collaboration, assist in accessing data, and to create effective reports.
How to Create a Power BI Banking Dashboard?
- The first step would be setting the business objectives, because the dashboard created without having any business objective would surely have many metrics that nobody would bother about on a daily basis.
- It would be important to connect data sources for the bank and they include the core banking system, loan origination system, and CRM.
- Data cleansing and data transformations can be done through Power Query, whereas business calculation and KPIs creation can be done using DAX.
- It is necessary that the design of visualizations takes into account the audience and includes both executive and operational views. In case your organization also engages in the process of mortgage lending, check out our guide on How to Build Loan Officer Dashboards in Power BI for Mortgage Teams, which provides practical tips on how to create dashboards for specific functions.
- Role-based access can be implemented using Power BI workspace and Row Level Security.
Common Challenges and How to Overcome Them?
- Low quality data leads to serious limitations of the dashboard developed using it, so data cleaning must be considered before the development of the dashboard, not at the end.
- When dealing with banking data, there is a need to provide security, and hence row-level security, encryption, and authorization are required in Power BI from the very beginning.
- While working with multiple banking systems, it is necessary to be aware that core banking systems may vary not only in terms of formats, but also in definitions. Hence, data modeling via banking analytics dashboard has to be done precisely before creating visuals.
- It will be challenging to gain user acceptance when Power BI dashboards for banks appear irrelevant to their activities, so high quality user training is essential just like the technology used.
Banking Dashboard Best Practices for Designing a Power BI Dashboard
- Pay attention to the banking KPIs used by company leaders for decision-making; otherwise, there is nothing to do about using all metrics available irrespective of their importance.
- Simplicity is essential for the dashboard, since the dashboard filled up with fifteen charts per screen is used less often than the one having only five relevant charts.
- Provide the same metrics on all the dashboards of the company in order not to have discussions on the same metric in the areas of finance and operations.
- Keep in mind the efficiency of the data loading process and performance of the dashboard itself, as the dashboard being overloaded will be very quickly ignored by its user.
- Lastly, check and update the KPIs periodically, as those KPIs that were crucial two years ago may be out-of-date now.
Real-World Use Cases of Power BI Banking Dashboards
The following banking dashboard examples show how different financial institutions use Power BI. In simple words, we can say that these financial dashboard examples demonstrate how banks analyze performance across departments.
- Retail Banking:
The retail banking group uses a banking dashboard in Power BI to monitor deposit growth, branch performance, and customer acquisition.
- Commercial Banking:
The commercial banking group monitors the concentration of loan portfolio, loan and the profit from portfolio based on the business sectors.
- Investment Banking:
The investment banking group looks at the trends in the deal pipeline and activities that generate revenue based on the company sectors.
- Loan & Credit Analysis:
The credit department collects the data related to approval ratio, non-performing loan trend, and underwriting time to create the dashboard.
Why Choose Power BI for Banking Analytics?
- Integration with the Microsoft Environment
Microsoft Power BI banking analytics integrates naturally with Excel, SharePoint, Azure, and other Microsoft technologies already used by financial institutions. So no major changes to the technologies used by banks will be required.
- Scalable for Financial Organizations (Creation of Power BI finance reports)
Whether it is an introductory dashboard in a community bank that operates in one branch or a complete reporting system in a regional bank, Power BI can be scaled without any change in the platform as the bank grows.
- Cost-Efficient Banking Business Intelligence Solutions
Unlike conventional BI solutions that are often costly because of licensing fees and the requirement for special software engineers, a Power BI bank financial dashboard makes a more budget-friendly option for the banks. If you hesitate which platform to use, we suggest checking our guide on the Best BI Tools for 2026 to know more about Power BI and other popular BI tools.
Technical Architecture: Modernizing Banking Data Pipelines for Power BI
To get the most out of Power BI banking dashboard implementation, financial organizations have to construct a solid, scalable technical stack behind the scenes. The banking sector is known for its high degree of complexity in terms of multiple systems used in it from the core banking system like FIS, Fiserv, Temenos, cloud-based CRM system, dedicated loan origination system, up to third-party risk management databases.
1. The Data Integration and Storage Layer
Modern bank analytics usually use an EDW or Lakehouse system like Azure Synapse Analytics, Snowflake, or Databricks to centralize and prepare the data for analysis. Performing queries directly from production core banking systems could affect the performance of the transactions at peak times. Through a modern data warehouse by automating the ETL/ELT processes, banks can convert their raw transactional data into efficient star-schemas.
2. Choosing the Right Connection Mode
Designing a Power BI dashboard calls for choosing the best suitable storage option depending on the amount of data and latency considerations:
- Import Mode: Executive dashboard is the best choice for performing historical analysis, generating reports and scorecards for executives who need in-memory queries. The data can be updated on a scheduled basis (frequent scheduled and ad-hoc refreshes according to licensing and capacity).
- DirectQuery: A must-have element when dealing with crucial real-time metrics like intra-day liquidity, fraud signals or high-frequency transactions which require that data remains in the source system.
- Composite Models: Combining Import Mode for large historical total sum with DirectQuery for real-time daily metrics strikes a good balance between speed and real-time data availability.
3. DAX Optimization for Financial Modeling
Data analysis expressions (DAX) function as the engine that runs the complex calculation of things such as the dynamic NIM and weighted average yields. Since there is a large amount of data in the financial industry with millions of daily ledger entries, it becomes crucial to optimize the DAX formula in the banking performance dashboard.
Governance, Compliance, and Data Security Frameworks
As the data being handled is extremely sensitive personal and financial data, it becomes vital for Power BI to be used throughout the company within a framework that meets regulatory standards (GDPR, CCPA, SOX, and GLBA). The implementation of a proper data governance program ensures that sensitive financial data is safe without limiting decision-makers’ ability to gain financial insights from such data.
1. Granular Access Control via Row-Level Security (RLS)
The primary element for securing the banking information in Power BI is Row Level Security (RLS). RLS helps in ensuring that users can see the relevant data pertaining to their own role, region, or branch. For example:
- A Branch Manager based in Chicago will log on to the dashboard, where he/she will see the figures that have been filtered specifically for his/her branch.
- A Regional Vice President will see the combined numbers for thirty branches in the midwest region.
- A Chief Risk Officer will be able to see the trends of non-performing loans in the institution as a whole, without any unwanted exposure to consumer PII.
2. Information Protection and Data Loss Prevention (DLP)
Banks can use the combination of Power BI with Microsoft Purview Information Protection to tag the reports as well as datasets with Security Labels such as Highly Confidential – Financial Data. The security labels are set even when the data is exported from the visuals to another format like Excel or PDF.
3. Auditing, Lineage, and Regulatory Compliance
Regulations typically require full transparency regarding the methodology behind calculations of the financial reporting key figures. Using Power BI’s Data Lineage capabilities, compliance officers and auditors can track the lineage of the report back to the semantic model, dataflows, and data sources used, with DAX formulas still available through the semantic model. Additionally, complete activity logs recorded in the Power BI Admin Portal can be used to document any and all activities related to reports, users’ credentials, and other changes that may affect auditing.
In Conclusion
The adoption of Power BI bank dashboard brings about revolutionary changes in the way that banks conduct data operations. Gone are the days when you would be wasting a lot of time sourcing information from various Excel spreadsheets; now you can see the real picture of all operations in one place.
With timely or even real-time updates regarding loan pipelines, net interest margin, and various other risk-related issues, decision making becomes easier for managers to do before it is too late. It makes the entire process of working much simpler. If your organization is still relying on old-fashioned reports, the adoption of the automatic dashboard will be the easiest choice.
Looking to build a custom Power BI dashboard tailored to your banking operations? Our team at Awesome Technologies Inc. designs secure, scalable, and interactive Power BI solutions that connect your data sources, automate reporting, and deliver actionable insights to help your institution make smarter business decisions.
Frequently Asked Questions
1. What is a Power BI banking dashboard?
It’s a visual reporting tool that connects to a bank’s core systems and displays financial metrics like loan performance, deposit growth, and NIM in one live, interactive interface.
2. Which banking KPIs should be included in a Power BI dashboard?
The loan portfolio efficiency, deposits increase, NIM, the amount of non-performing loans and the branch profit are the indicators that banks usually monitor first.
3. How does Power BI improve financial analysis?
The tool centralizes scattered/different data sets, provides data updates via scheduled refreshes or real-time connections, and enables the analysts to search and drill the performance data directly replacing slow financial reporting.
4. Can Power BI connect to core banking systems?
Power BI can connect to almost every database and cloud service banks use today. Therefore it can be perfectly integrated with core banking systems if data modeling is right.
5. Is Power BI secure enough for banking data?
If you implement the necessary management of the tool and follow Microsoft’s security measures, Power BI can be used safely for banking analytics.