Switch: An ETL Tool You Deserve

Switch is an excellent ETL tool for data warehousing. Designed for multiple industries including mortgage organizations, Switch empowers businesses to build powerful data warehouses and extract useful information hidden behind the numbers. With our ETL tool extract, transform and load data into the warehouse for further analysis in just a few clicks.

Ready to Switch?

ETL Process in Data Warehouse

etl 1

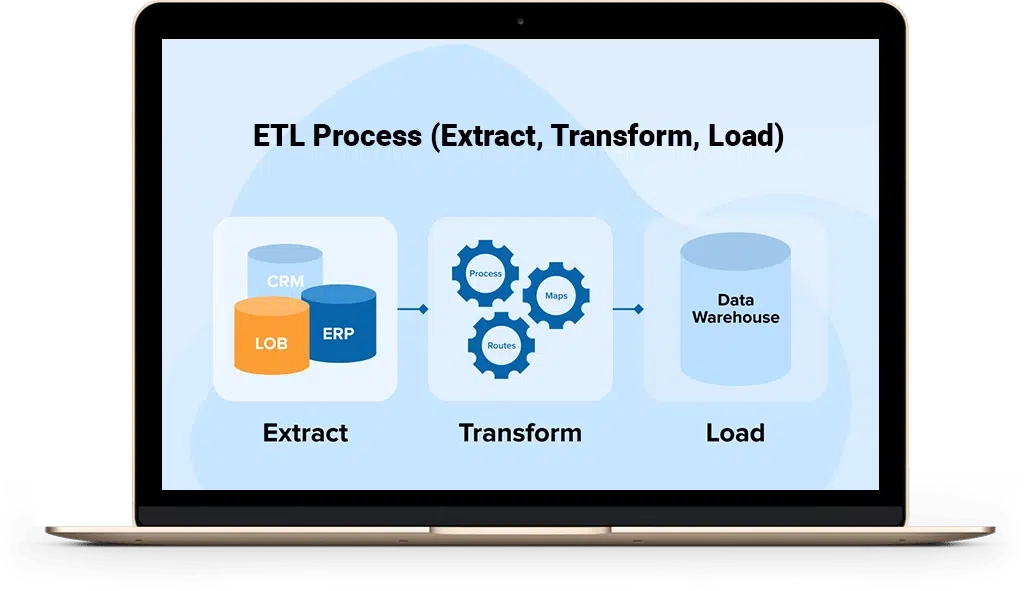
Extract: Gathering Data from Multiple Sources

The first step of the (Extract, Transform, Load) ETL in data warehousing is extracting data from a variety of sources, including LOS ( Loan Origination System), CRMs, databases, spreadsheets, flat files, and APIs. Switch – our ETL tool for data warehousing smoothly pulls data from these sources. Regardless of whether your data is structured, like information from databases, or unstructured, like data in spreadsheets, Switch can handle it all with ease.

Transform: Data Cleaning and Refinement

Raw data means it needs cleaning and transformation before it can be useful. Switch cleans your raw data, refines it and makes it valuable for further analysis. Moreover, Switch gives your data guys the ability to customize the data to fit the needs of your business and reporting requirements. Our team at ATI knows the importance of a good UI/UX which is why we have equipped Switch with a user-friendly interface so you can easily combine data, remove duplicates and create new data points according to your needs.
etl 2
etl 3

Load: Moving Processed Data

Once your company’s data is ready Switch loads it to the target system which can be a data warehouse or data lake for further analysis. This process is quick and secure and requires minimum to zero efforts. Switch responsibly loads your data correctly and efficiently, lowering the chance of errors.

Visualize: Turning Data into Insights

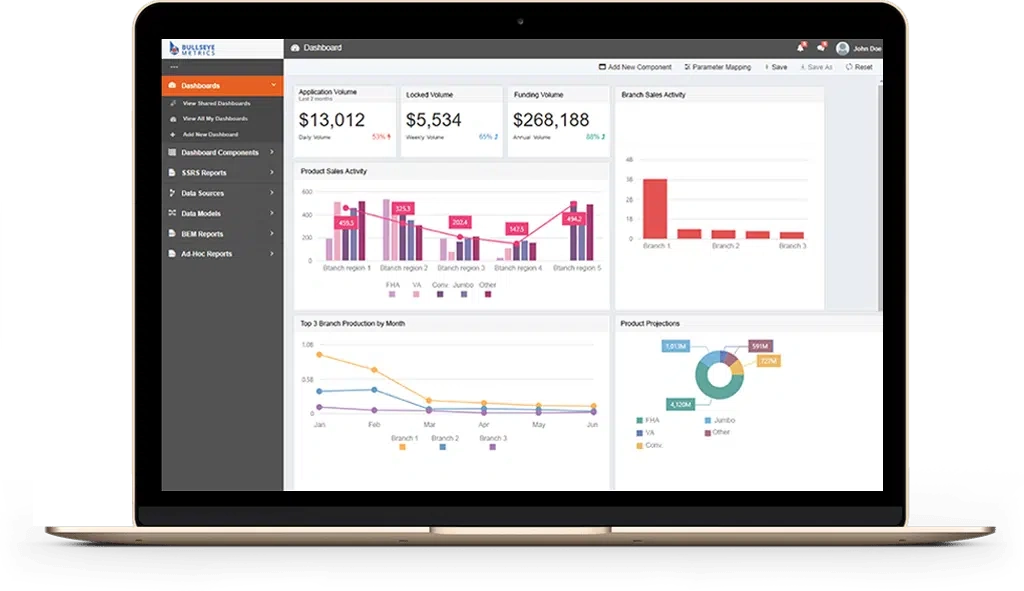
This is the stage where the magic happens: turning data into easy to understand visuals. You can discover hidden patterns and trends in your data much faster by using visuals instead of just numbers. With tools like QlikView, Tableau, Power BI, or Bullseye, your team can easily explore the data and share their findings.
etl 4

Key Features of our ETL Tool

Information Dashboard

Information Dashboard

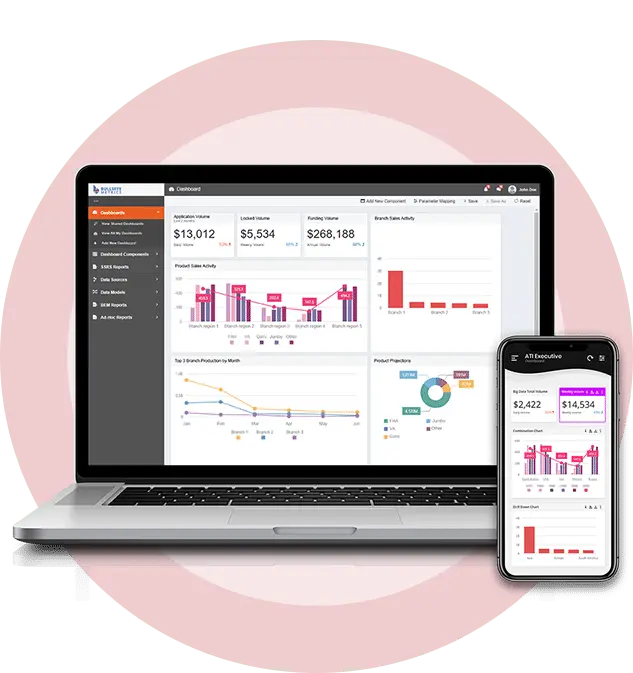
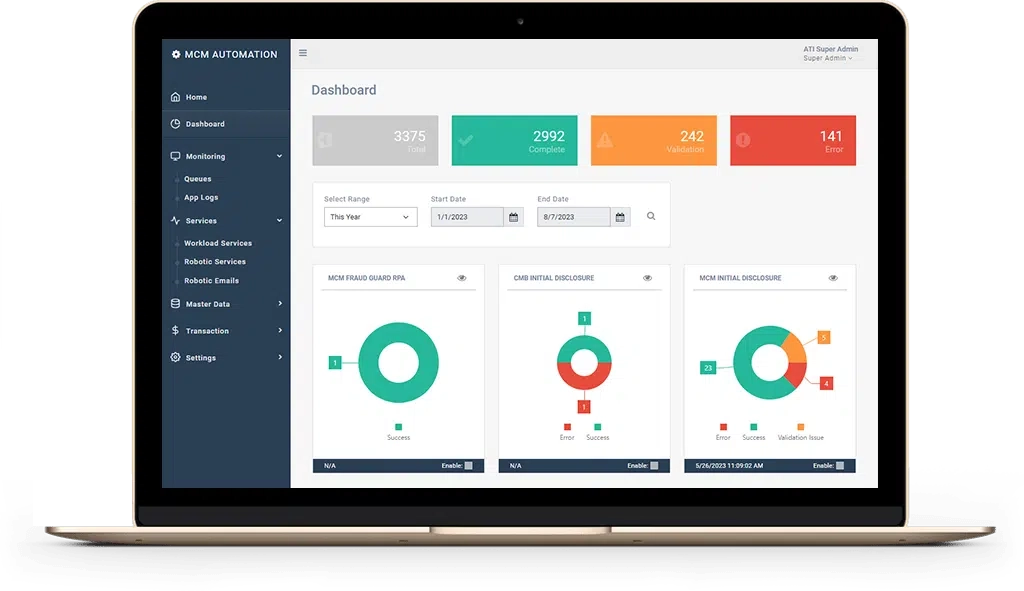
Gives you a clear picture of how your company is doing. Critical metrics are shown in visual presentations so you know what's happening in real-time.

LOS Field Selector

LOS Field Selector

With Switch, you are in control. Our ETL software for data warehousing lets you change your Loan Origination System data exactly how you want it. Add, remove, or edit fields to fit the needs of your business.

Diverse Data Collection

Diverse Data Collection

Whether your data is stored in databases, spreadsheets, or online, Switch can pull data from almost anywhere and combine it all in one place.

Field Import Status Queue

Field Import Status Queue

Our field import status queue gives you a clear picture of your data's journey. You can keep track of which fields have been imported and their current status.

Ad hoc Reports

Ad-hoc Reports

Take control of your data exploration. With Switch as an ETL service, you can query fields and their data directly within the platform, assuring the accuracy of your imported data.

Calculated Fields

Calculated Fields

Switch brings you the power of customization. Utilize Query or C# code to create calculated fields, enabling functionalities like name concatenation or data masking.

Benefits Of Our ETL Tool

Untap the hidden potential of your data with Switch. Transform the way you manage, combine, and use your data for your business growth.
1

Data consolidation

ETL tools for data warehousing can combine various data sources into a single view. This makes it easier to analyze, visualize, and understand large datasets.

2

Better Data quality

Switch can clean and organize data to improve its quality and consistency. The processes include removing irrelevant, duplicate, or missing data, and ensuring that all data matches the required format.

3

Faster data analysis

ATI’s ETL platform provides more stable and faster data analysis because the data set has already been structured and transformed.

4

Time and Cost Savings

Switch – an ETL data warehousing tool can free up developers from technical tasks related to data movement and maintenance, allowing them to focus on other work.

etl 5

Choose Switch For ETL and Data Warehousing

Switch is more than just a tool for managing data. It can help your lending business grow and succeed. Switch gives you more control over your information, empowering you to make better decisions. So why wait to use your data in the best way possible. Make the ‘Switch’ today and see how you can improve your operations and expand your business.

FAQs

Switch is an ETL tool that helps mortgage organizations extract, transform, and load data. It improves data quality, automates workflows, integrates diverse data sources, and ensures regulatory compliance, leading to better decision-making and operational efficiency.

ETL (Extract, Transform, Load) is a data management process that involves gathering data from different sources, modifying it, and loading it into a data warehouse. Data integration is a broader concept that includes techniques to combine data from disparate sources. ETL is one of the data integration methods that enables data extraction and transformation.

We offer comprehensive support and training to ensure users can fully leverage our ETL platform’s capabilities, including documentation, tutorials, and guides that walk users through various features and processes. We also provide customer support channels like email, chat, or phone to address queries or issues.

Switch prioritizes user-friendliness, making it accessible for both technical and non-technical users. The intuitive user interface allows non-technical users to apply custom transformations, create calculated fields, and generate reports without requiring extensive coding knowledge.

Switch integrates with advanced data visualization tools like QlikView, Tableau, Power BI, or Bullseye. These tools allow you to create interactive dashboards, charts, and graphs to identify trends, patterns, and correlations within your data. You can visually represent complex data relationships and share these insights with your team.

Still, have some questions? Don`t hesitate to contact us.
Lawrence Lebron
FORMER CIO OF A MORTGAGE COMPANY
Read More
"Based in Southern California, our mortgage company experienced exponential growth over the last 18 months at it would not have been possible had it not for ATI. Their contribution tools and customization allowed us to manage our growth and reduce risk."
Northern Mortgage
Pava J Leyrer CMC, CRMS, CMP | Chief Operating Officer
Read More
"We worked with ATI on several projects and tasks. They were very attentive to our situation and needs. When presenting our issues they worked to provide solutions to improve our operations."
Mark Todd
National Sales & Client Services Manager
Byte Software, LLC
Read More
"In my tenured experience with ATI, I am unaware of a missed expectation. I continue to refer their services because our clients tell us, “They delivered what they promised.” Additionally, team-members are consummate professionals, and it’s with great confidence that I refer their services."
Lance Logan
COO - Great Western Financial Services
Read More
"ATI have been very effective in listening to our needs and then converting those ideas into actual results and processes in Encompass. Team’s experience in the mortgage industry with other companies has also helped. We believe we have avoided some delays and missteps by getting their feedback on what has and has not worked in the past."
Previous
Next

YOU ARE IN GOOD COMPANY

Helping customers to create better mortgage experience

Empower Your Compensation Strategy and Onboarding Process with ATI